|
Broadcasting Industry Key Figures
The following data collected until December of 2011 provide a quick overview of:
the industrys position; recent changes; and emerging trends.
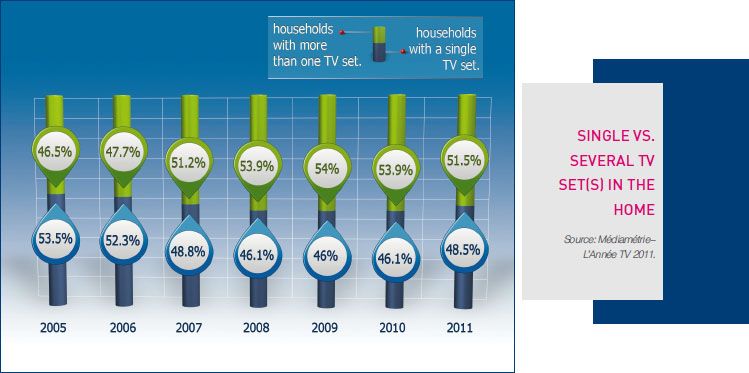
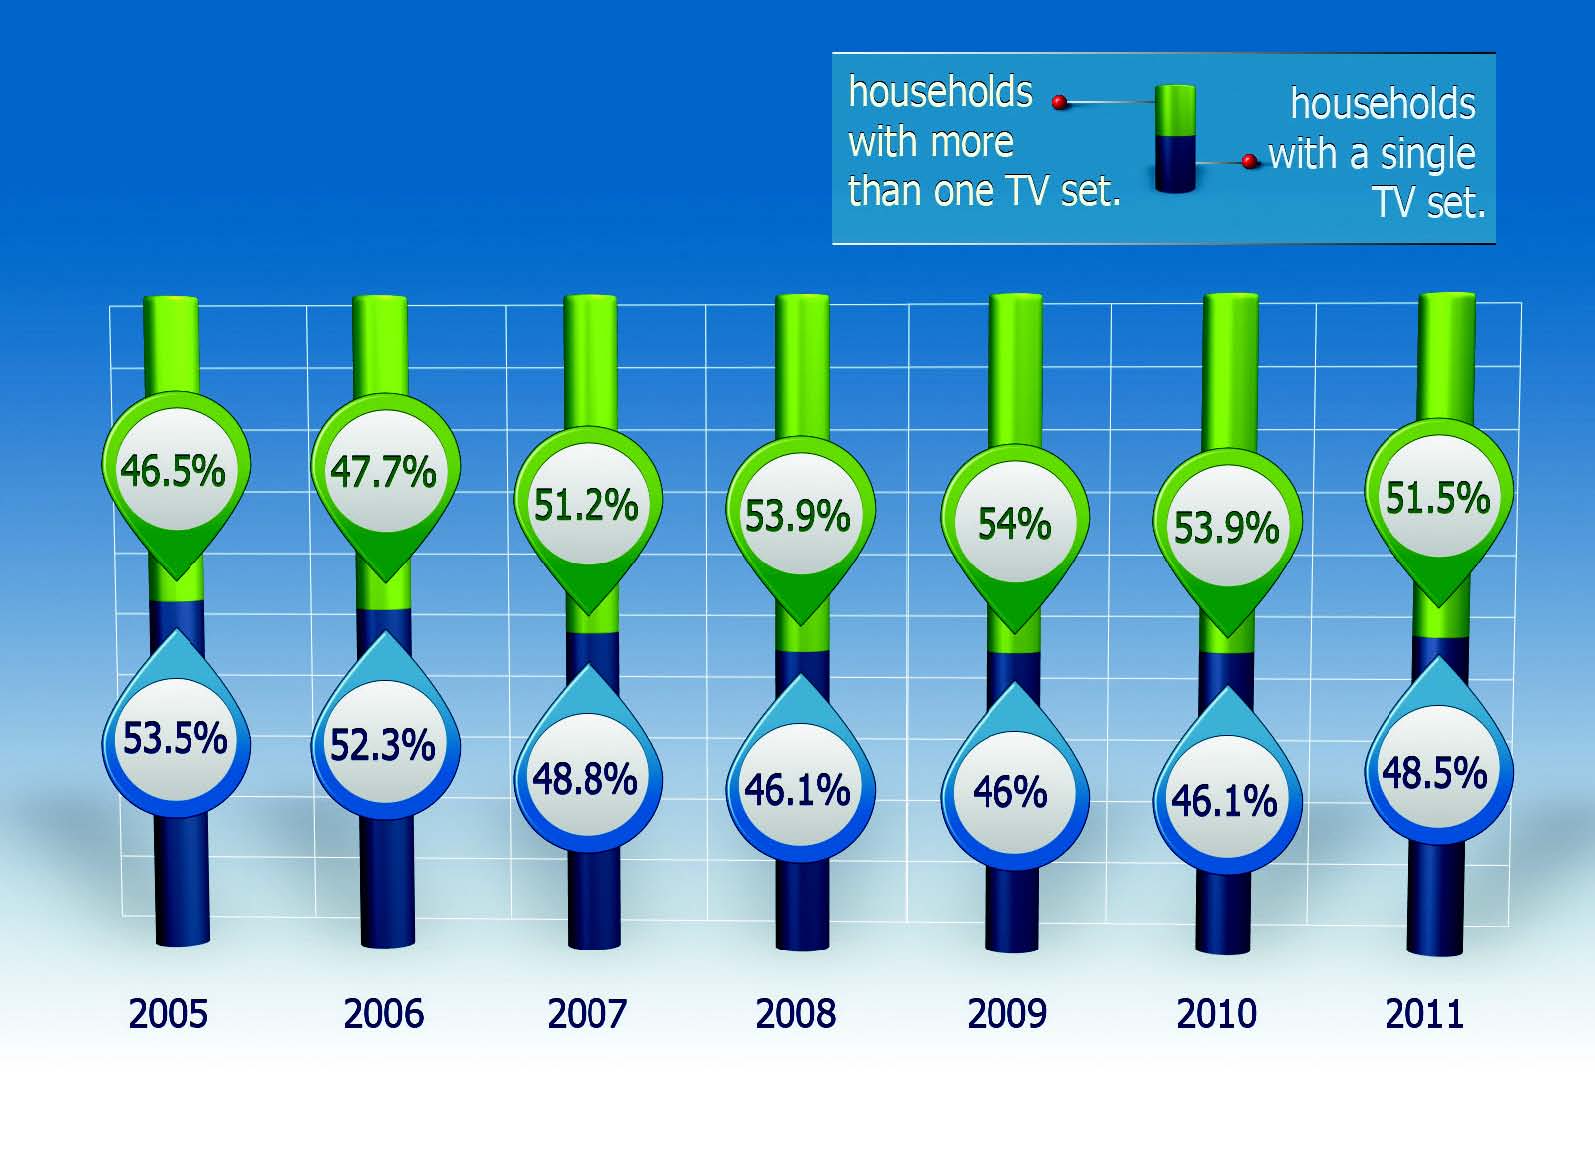
In 2011, almost all French households had at least one TV set (98.2%). Almost
one in two had more than one.
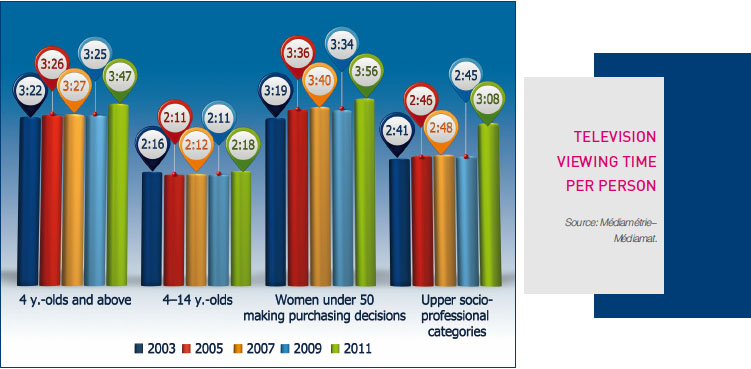
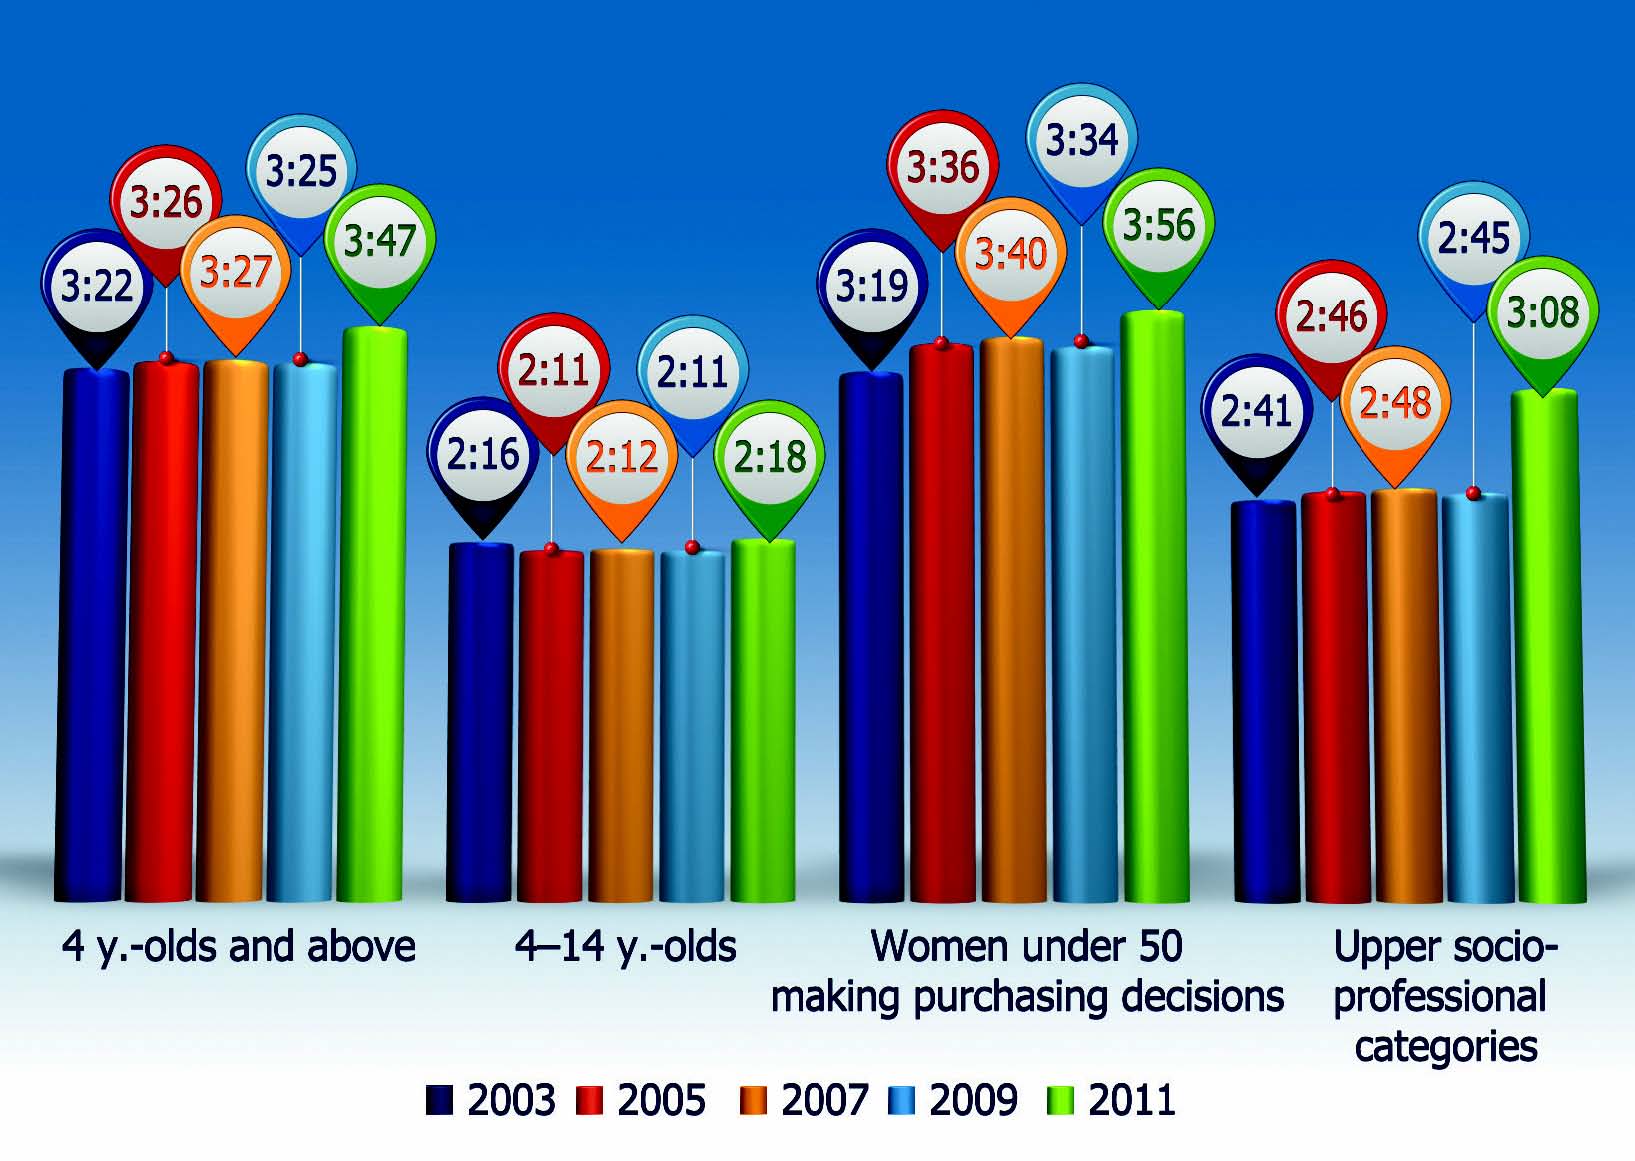
In 2011, in France, on average, those over 4 years of age, with a TV set, watched
3 hours and 47 minutes of television per day; namely, 15 minutes more than in
2010.
Note: as from 1 January 2011, when computing a TV programme's audience, Médiamétrie
includes viewings through personal recordings of the programme, or using time-shifting (not
including catch-up TV), and watched within seven days of their broadcasting. This change in
method accounts for the approximately 4-minute increase in viewing time between 2010 and
2011.
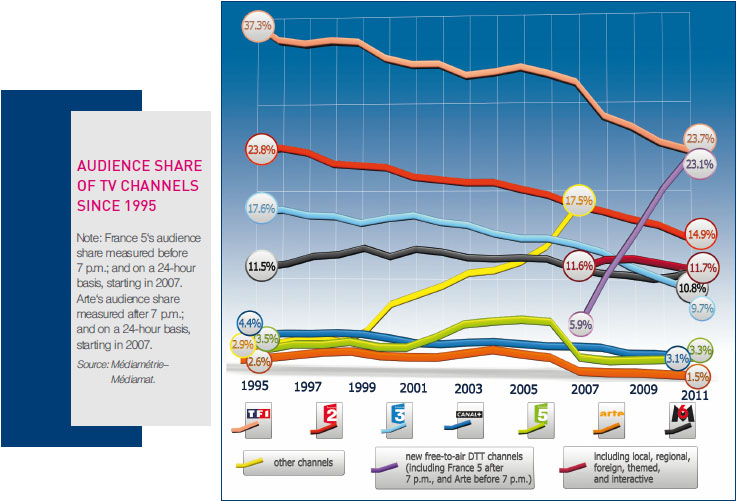
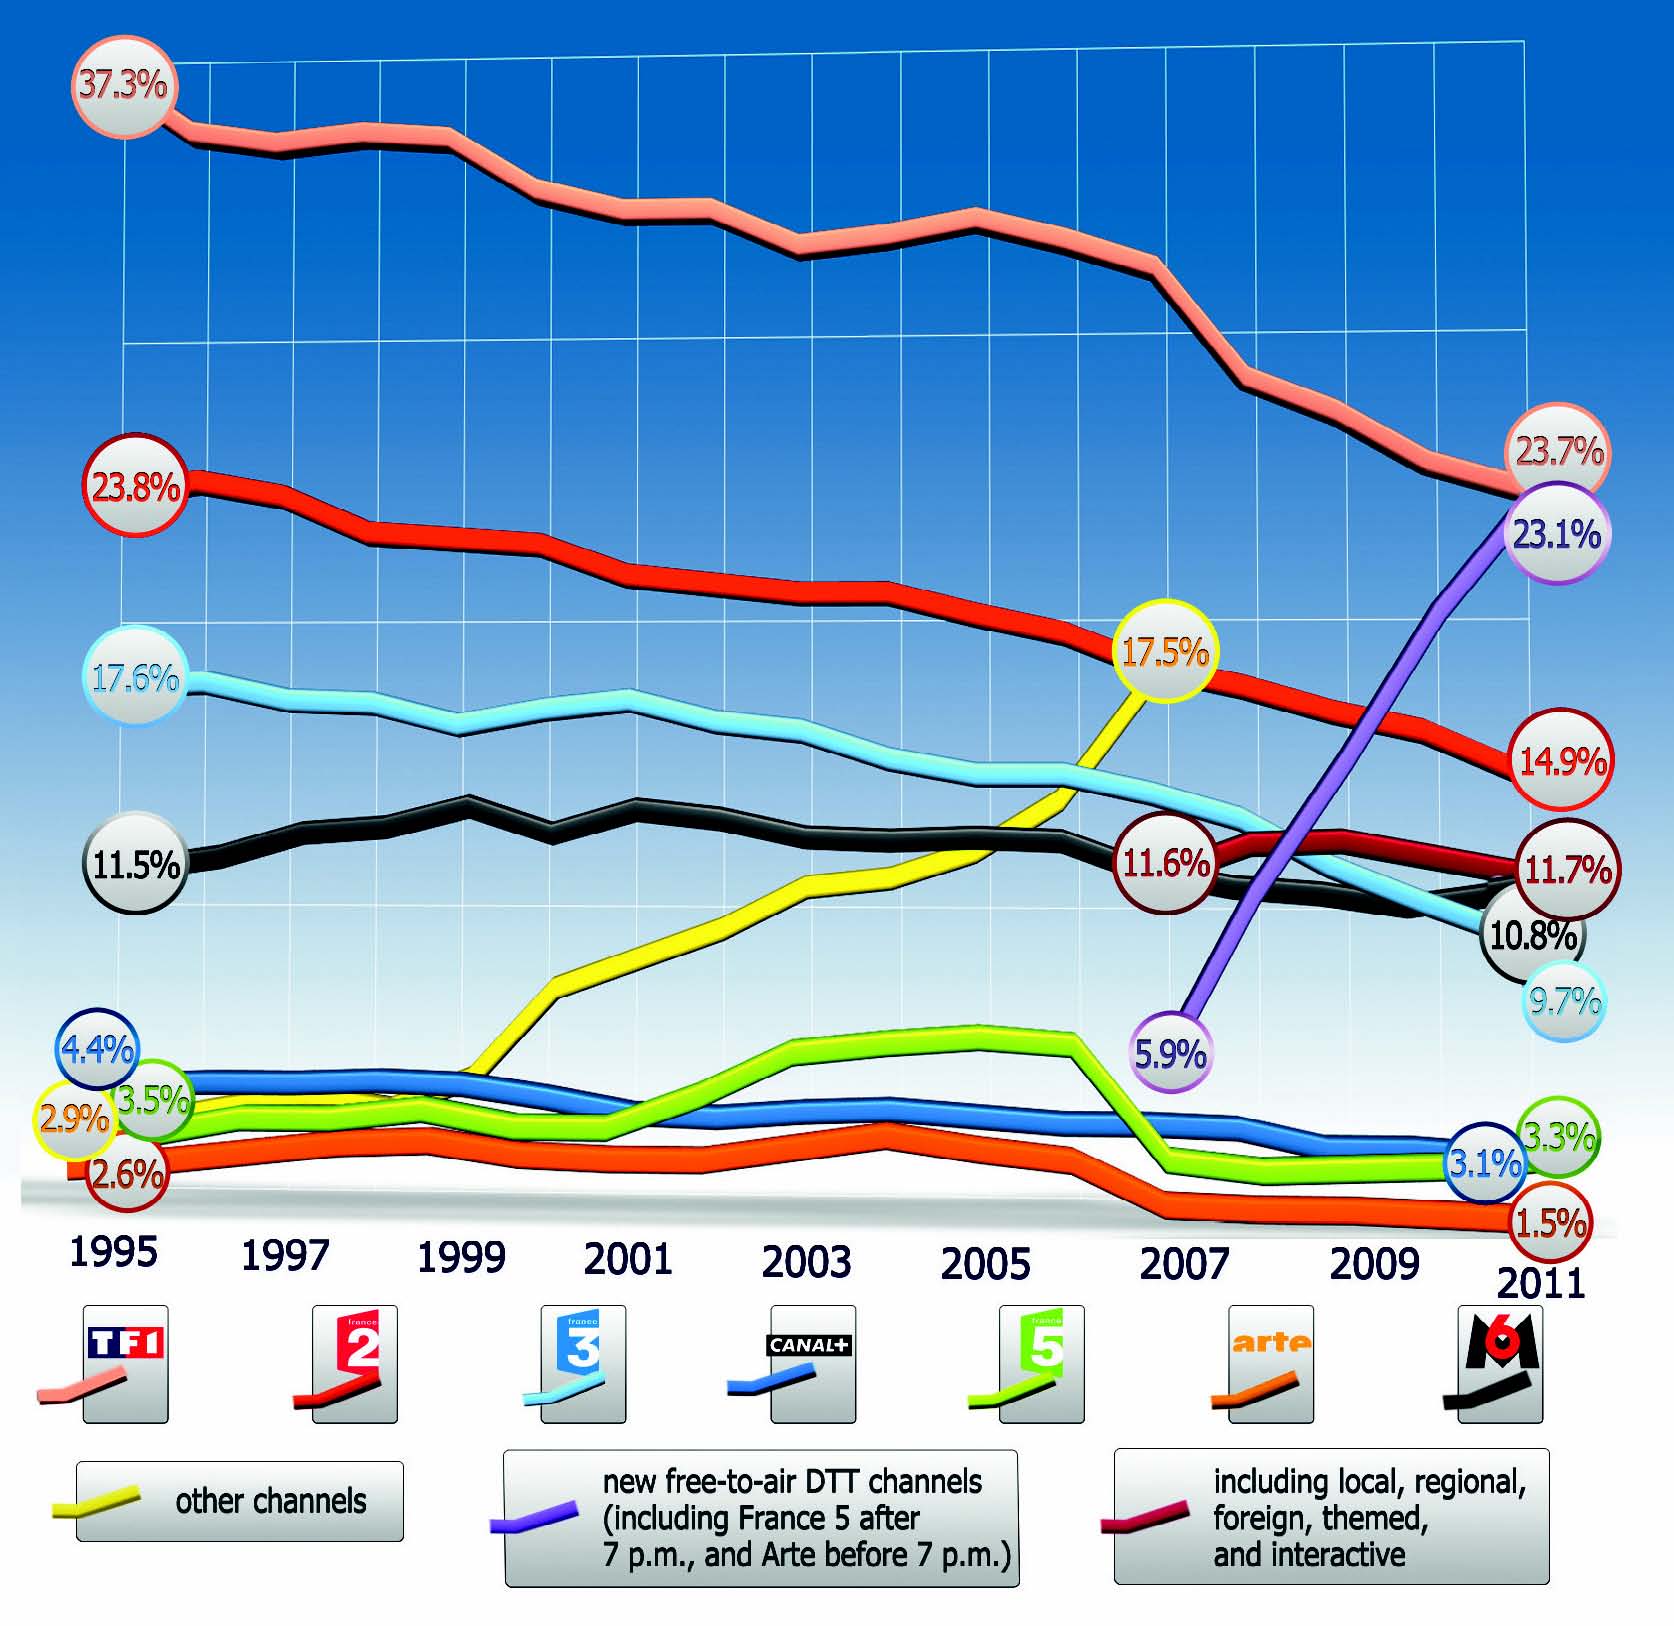
There were two successive major trends since 1995, as the audience shares
of incumbent off-air channels declined:
- between 1995 and 2004: cable and satellite channels' audience shares
increased by approximately 8 points;
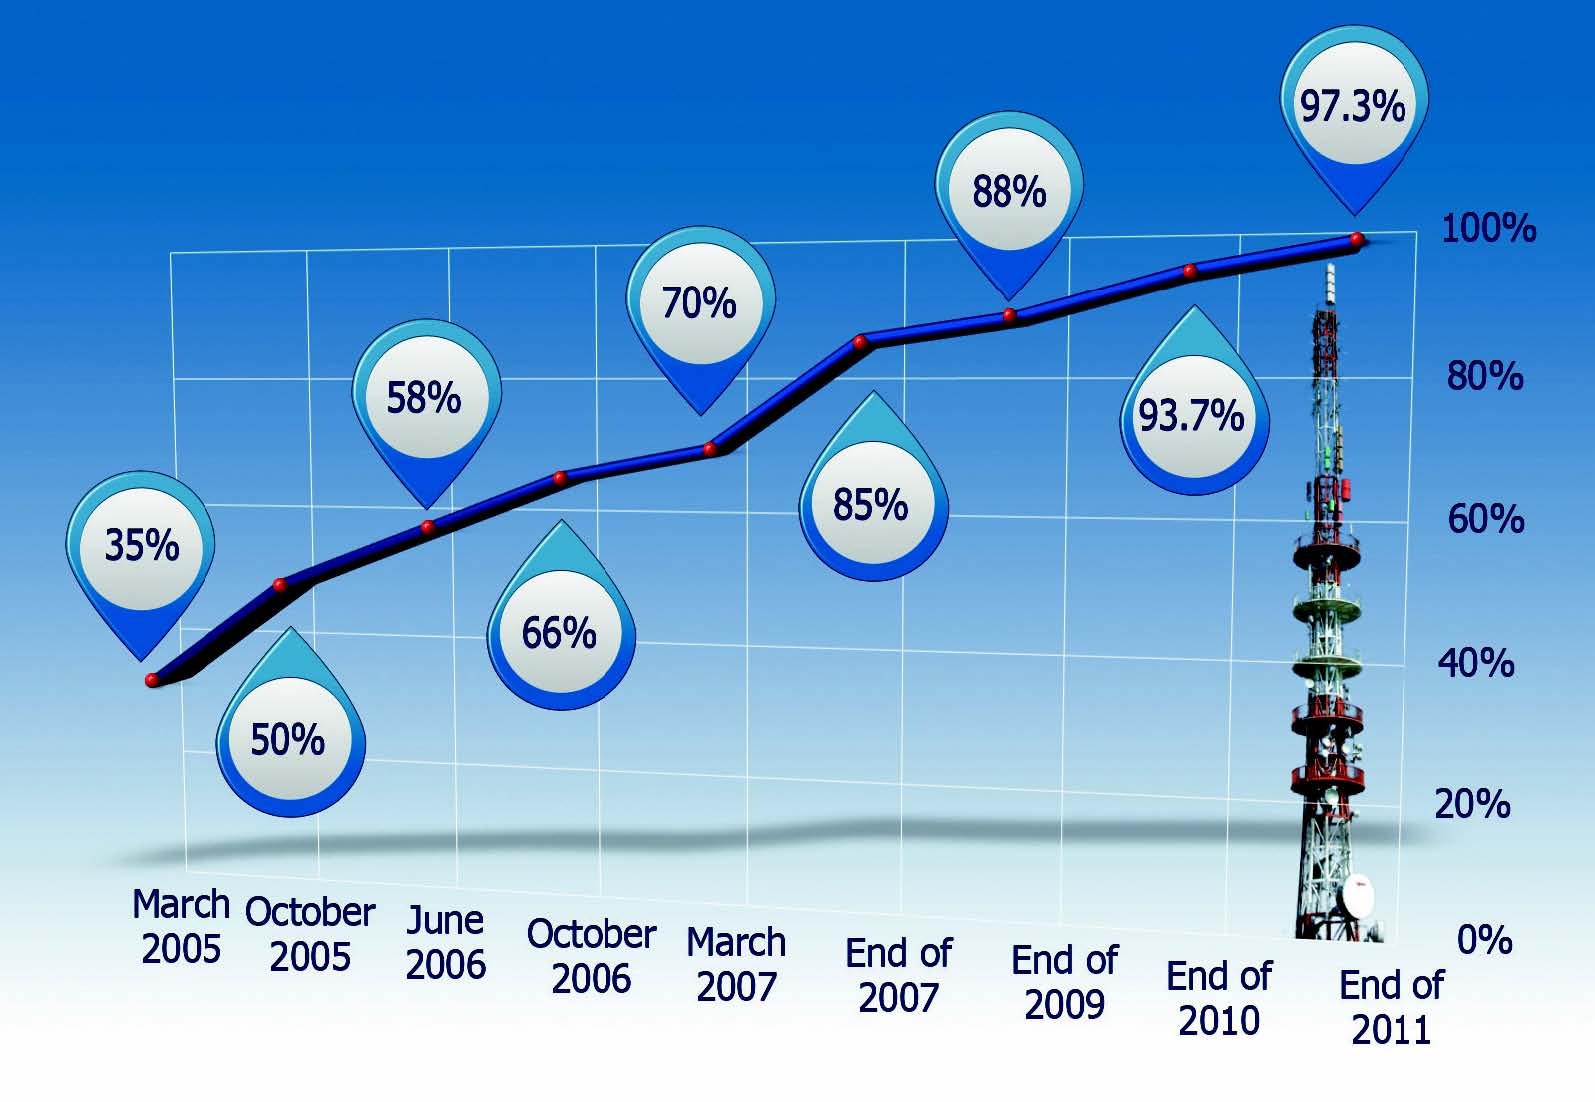
- subsequently, from their 2005 launch onwards, the audience shares of new
free-to-air DTT channels (local channels not included) rose rapidly,
reaching 23.1% in just six years.
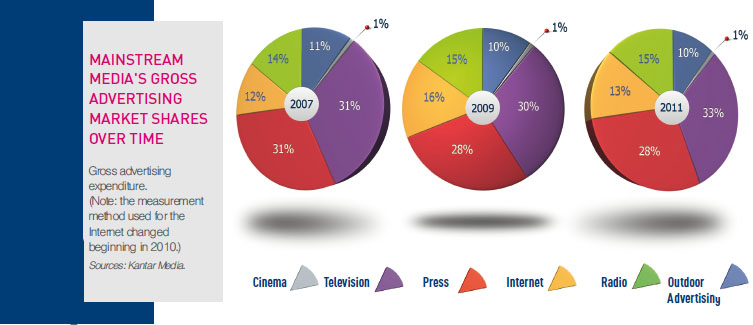
Between 2006 and 2011, television took first rank, before the presswhich
experienced a significant loss, and radio. Internet continued to emerge as
a major player.
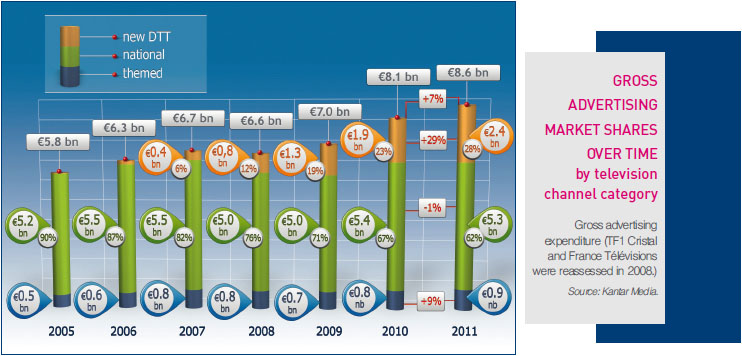
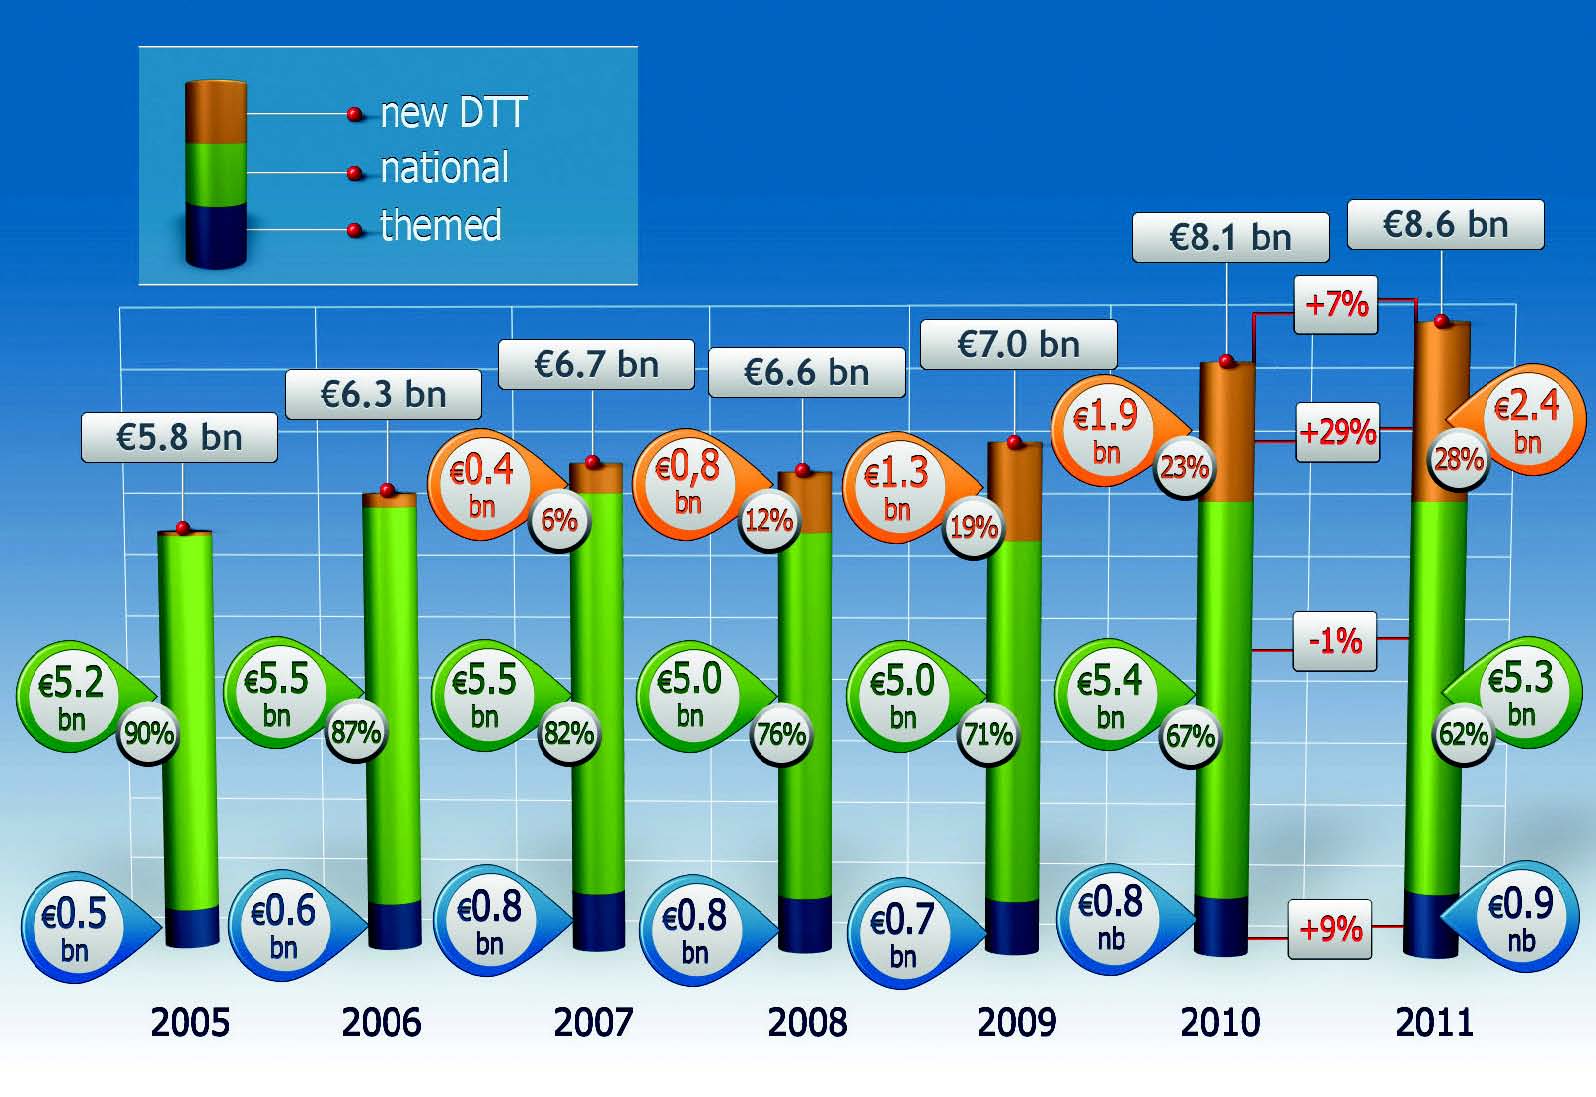
The advertising revenue of new free-to-air DTT channels has grown rapidly since
DTT's launch in 2005 (a six-fold increase between 2007 and 2011.)
In 2011, the growth in gross advertising expenditure (+7% compared with 2010)
benefited new DTT channels (+29%), and cable and satellite themed-channels
(+9%). However, between 2010 and 2011, gross advertising expenditure
decreased 1% on incumbent channels.
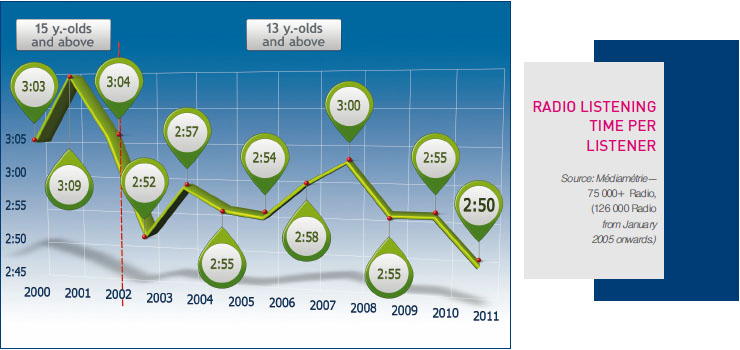
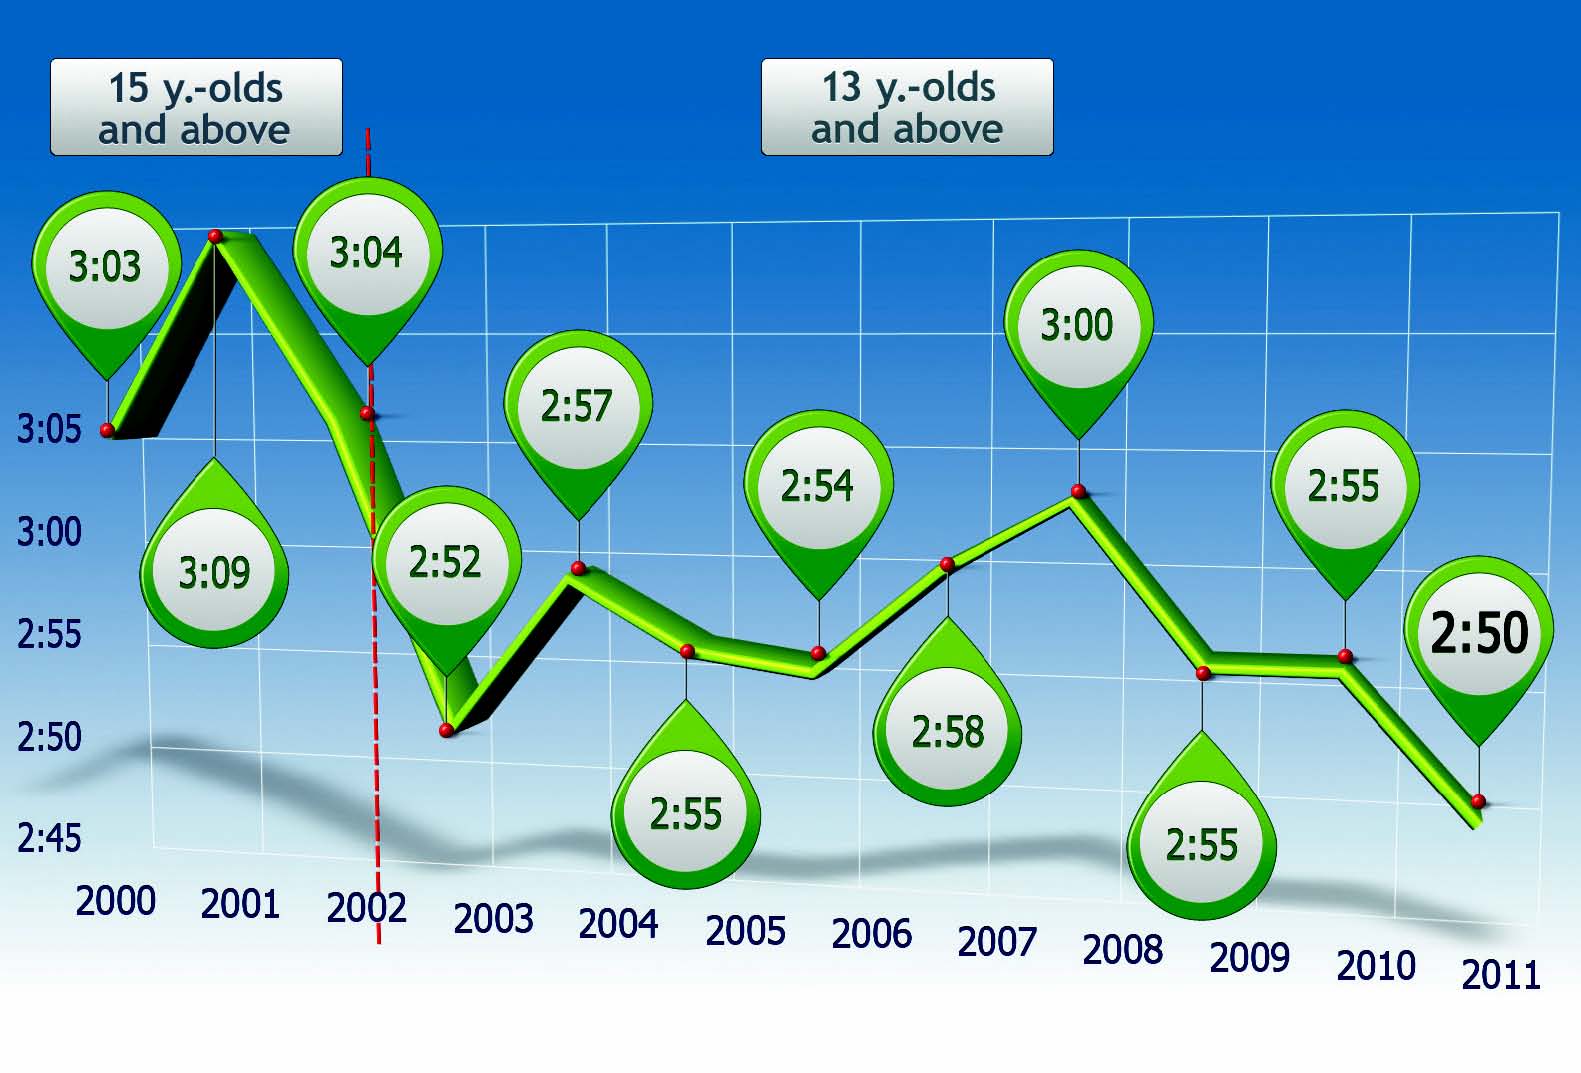
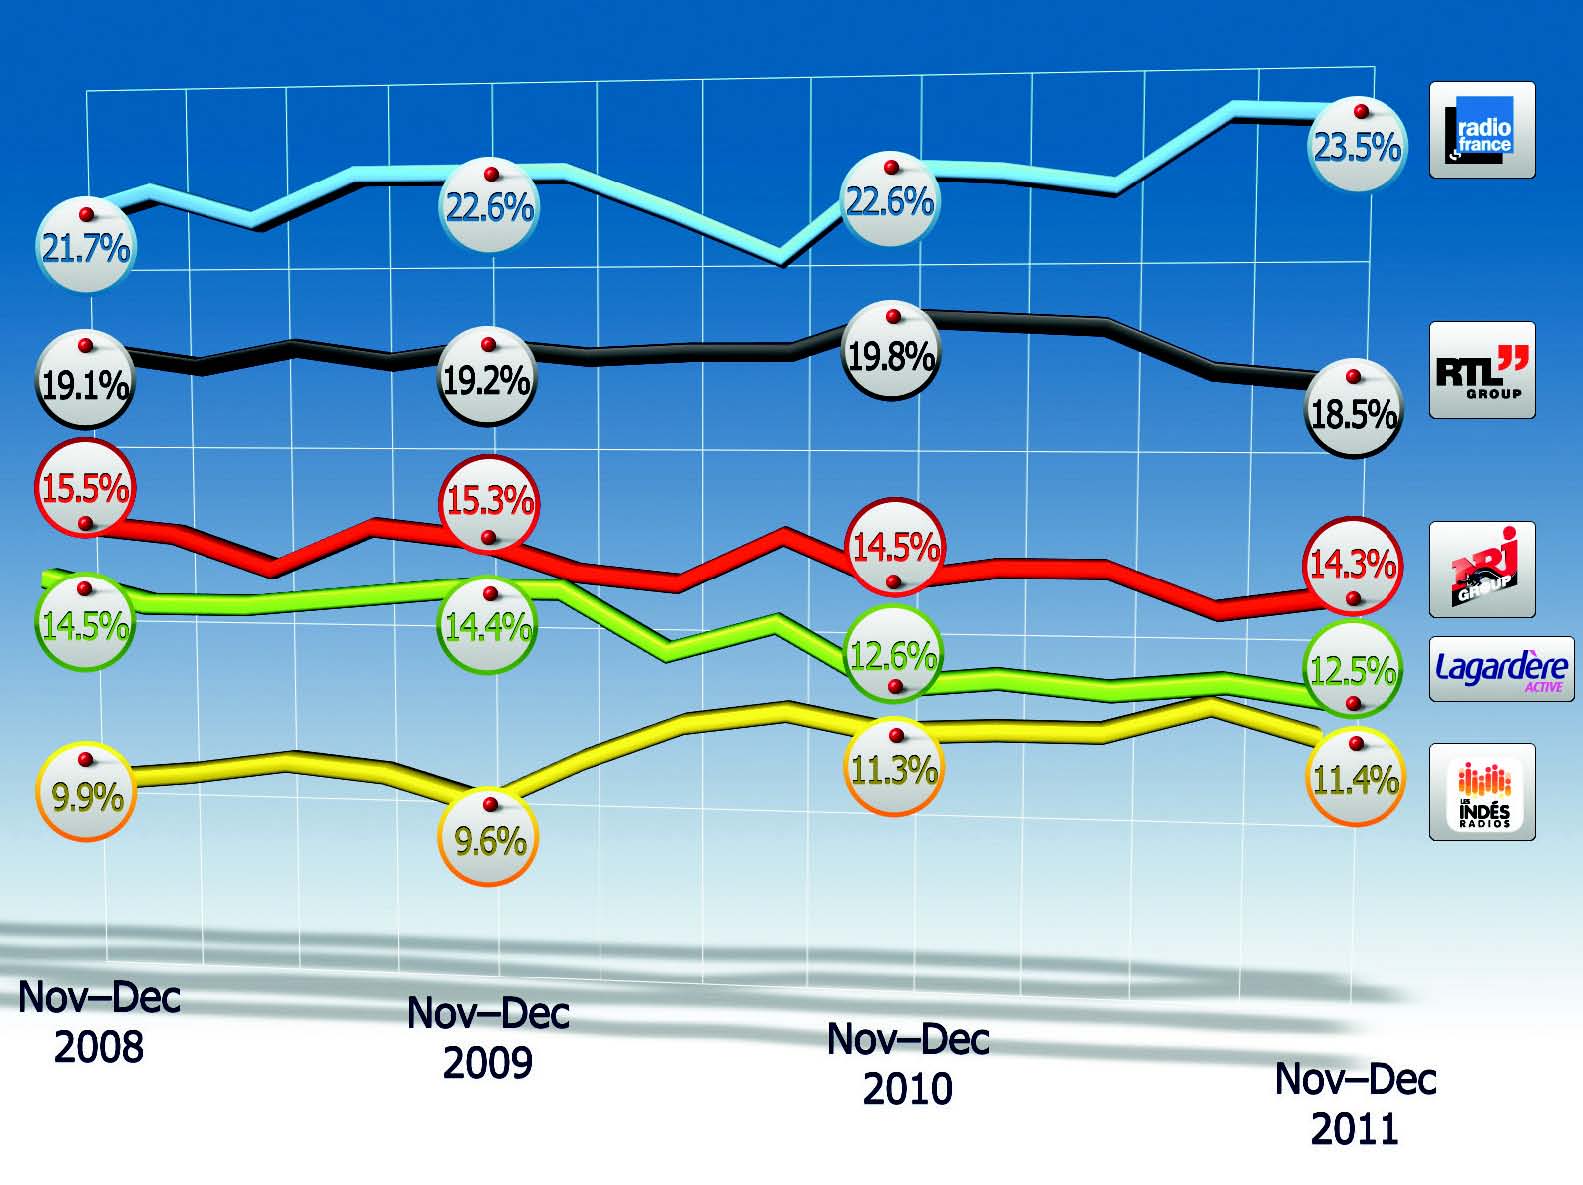
At 2 hours and 50 minutes, from 2 hours and 55 minutes, the average daily
radio listening time of those over 13 years of age decreased 5 minutes,
between end of 2010, and end of 2011.
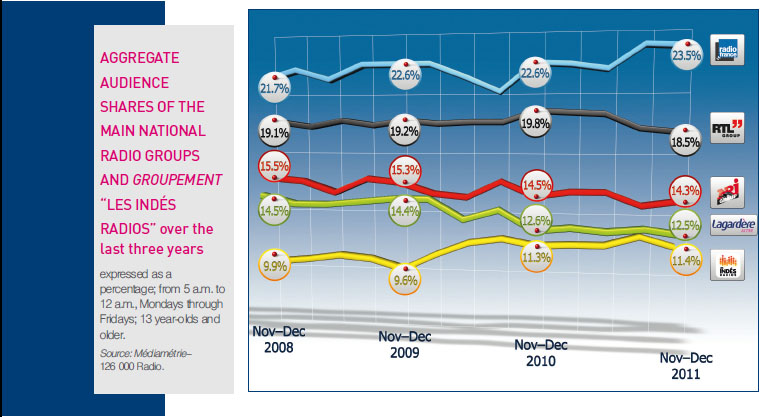
The aggregate audience shares of the various radio groups and groupement
Les Indés Radios are calculated by adding the audience shares of their
respective stations.
Note: groups included in this indicator own at least two national networks, with the exception
of Nextradio TV, whose BFM station does not subscribe to the 126 000 Radio survey.
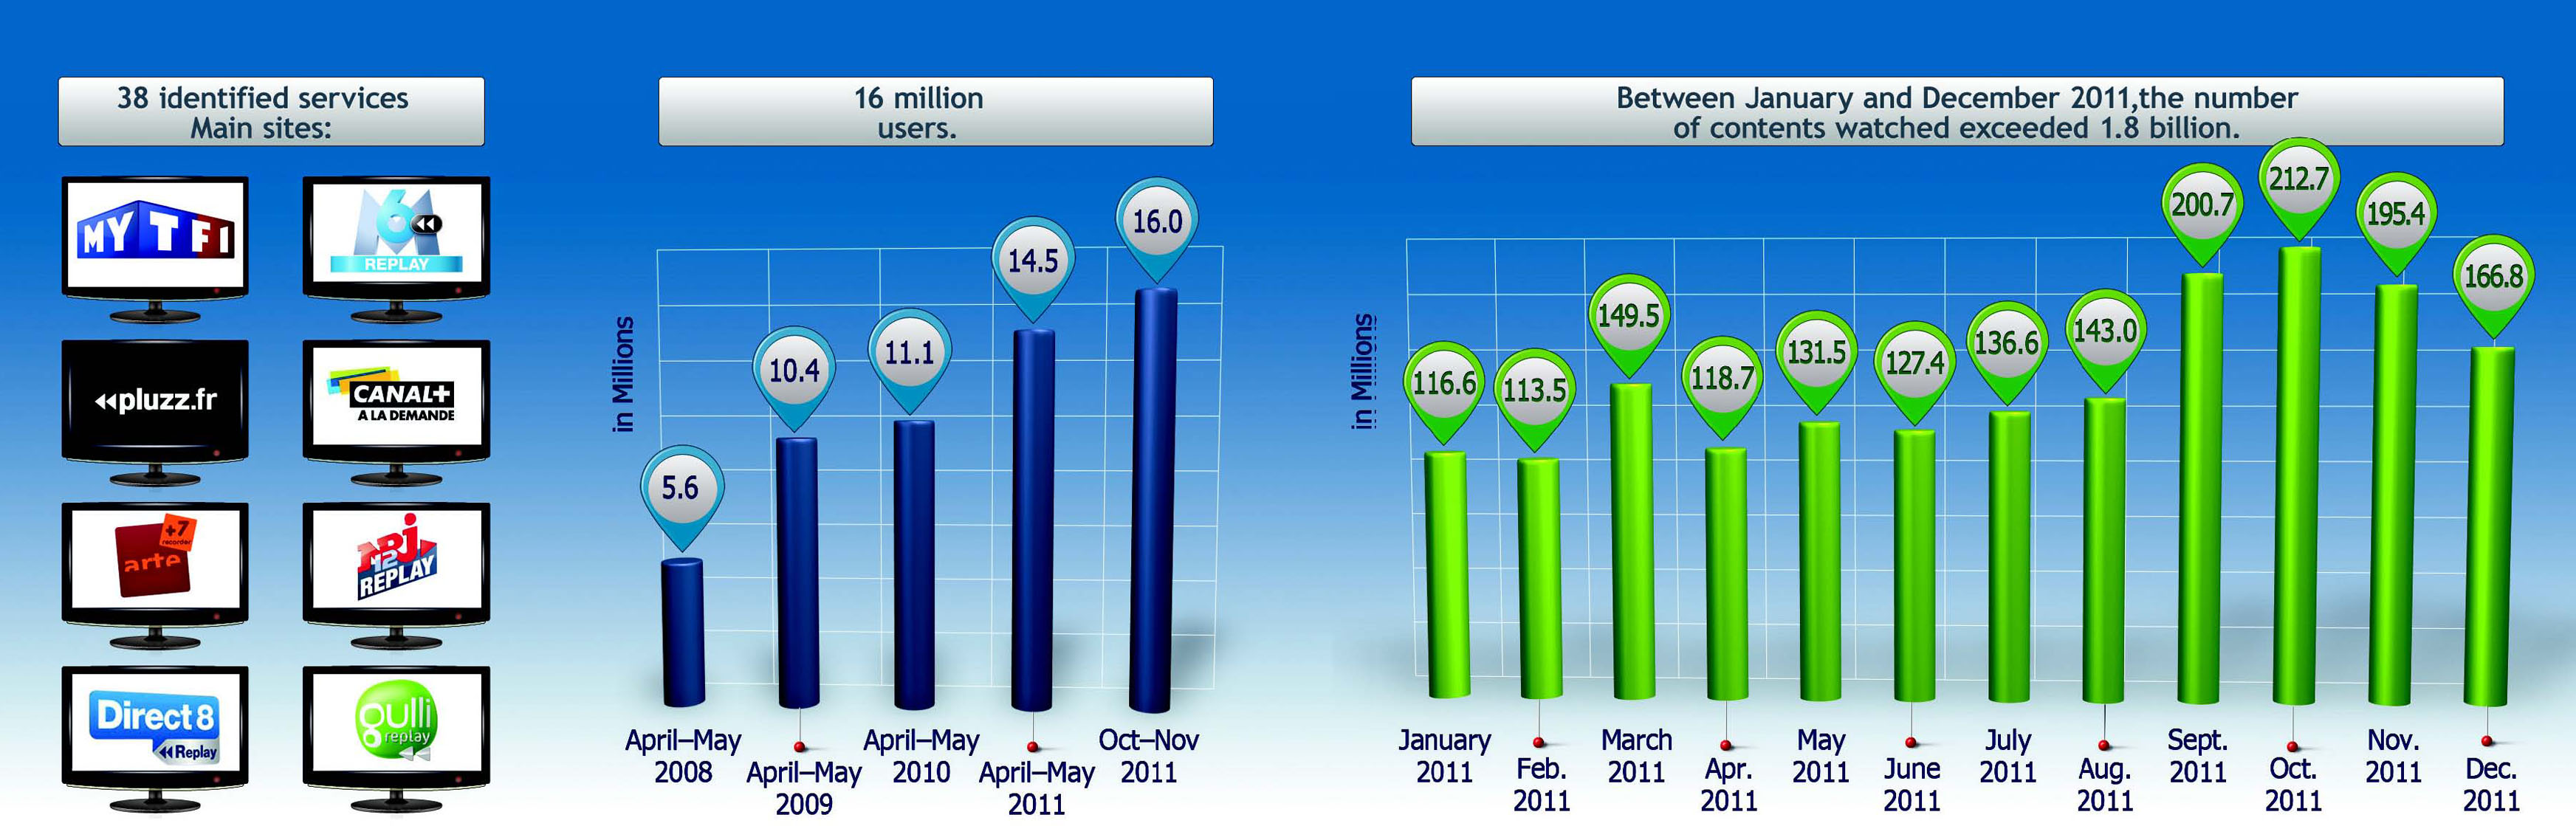
Viewers of at least one TV
programme through catch-up TV.
Programmes watched through catch-up TV offered by channels TF1, LCI, M6, W9,
Téva, Paris Première, Canal+, i>Télé, France 2 , France 3, France 4, France 5, and
France Ô.

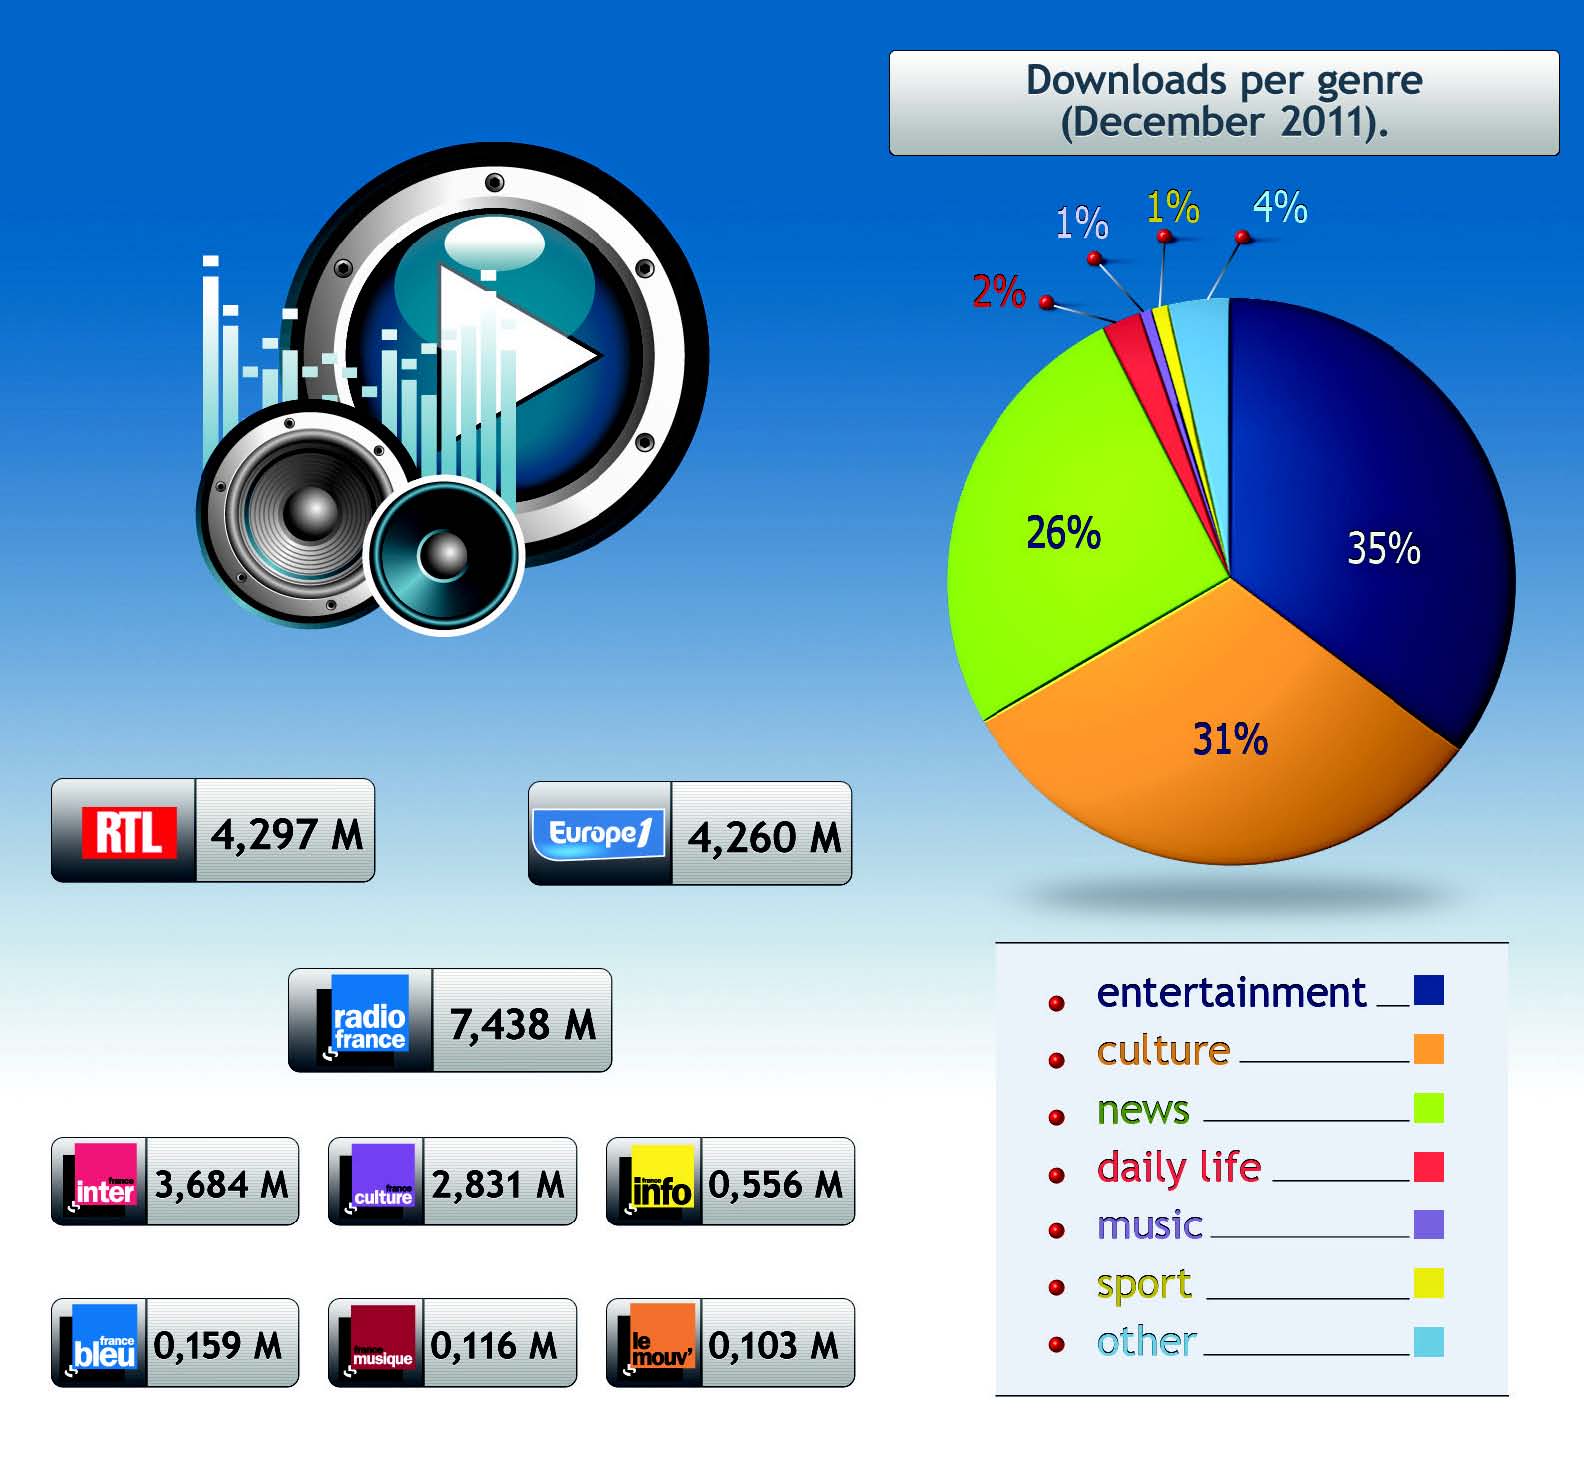
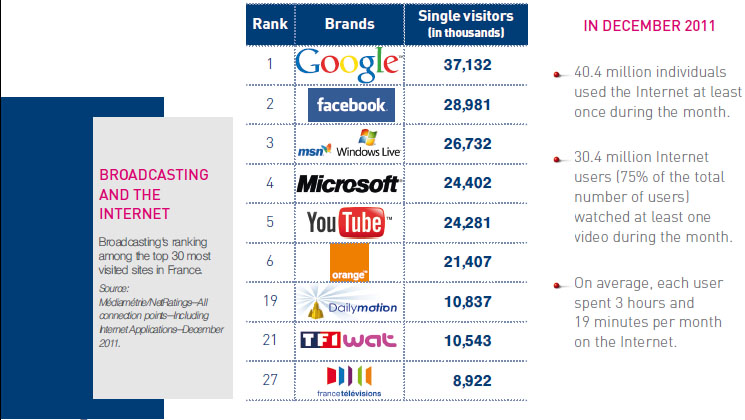
In December 2011, in mainland France (métropole), 16 million podcasts were
downloaded.

|